

Application of proximity and velocity sensors to define distance between bench marks in the field.
GPS calculates distance between ground points as per coordinates’ differential so it works efficiently at long distances (measurement error does not accumulate), however for short distances (kilometer and less) with a complex curve profile and altitude variations accuracy will be considerably decreased.
An optical speed sensor (optical ISD-3 or laser ISD-5) calculates the distance based on measured velocities (as a sum dSi=Vi*dt) with an accuracy of centimeters. Although the absolute path measurement error might occur on long distances (kilometer and longer) due to calibration inaccuracy or noncollinear sensor installation in the vehicle (see ISD instruction manual). Integrated operation of these sensors shall offset advantages against disadvantages.
Usually measurement data is presented as follows:
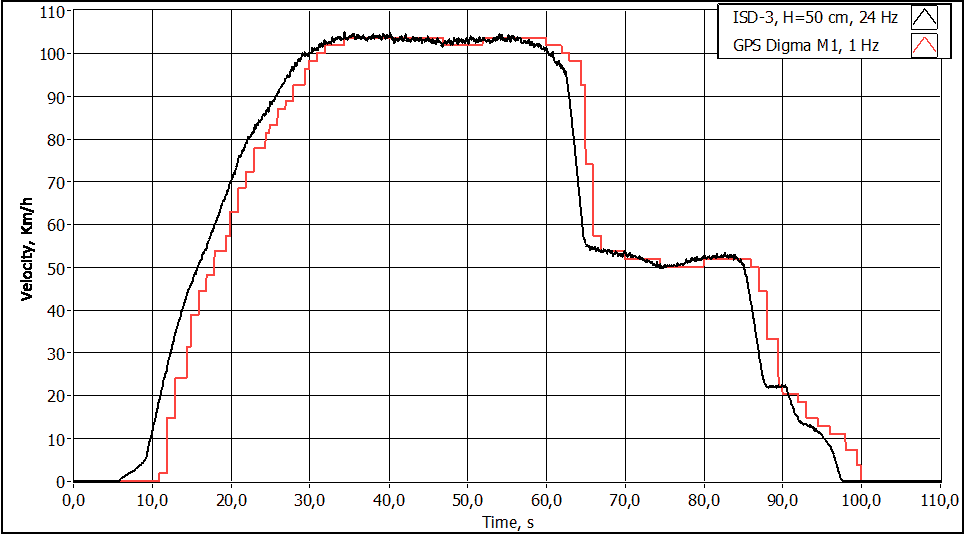
Optical sensor with measurement frequency 24 Hz was used for this case. GPS data are delayed for 1 second and GPS sensor is functioning at 1 km/h sampling rate.
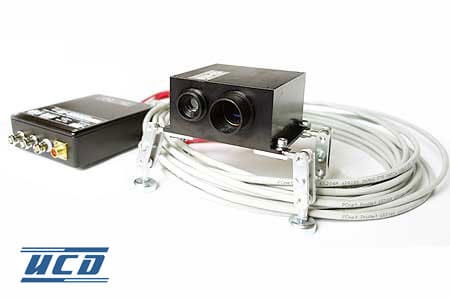
Practical application data on ISD&GPS combined operation is given below with an example provided by HereMap (summer 2015, travel in the Far East and Siberia). Laser sensors ISD-5 with a distance range to the road surface 60±20 cm and measurement frequency 54 Hz and standard GPS modules with measurement frequency 1 Hz were used.
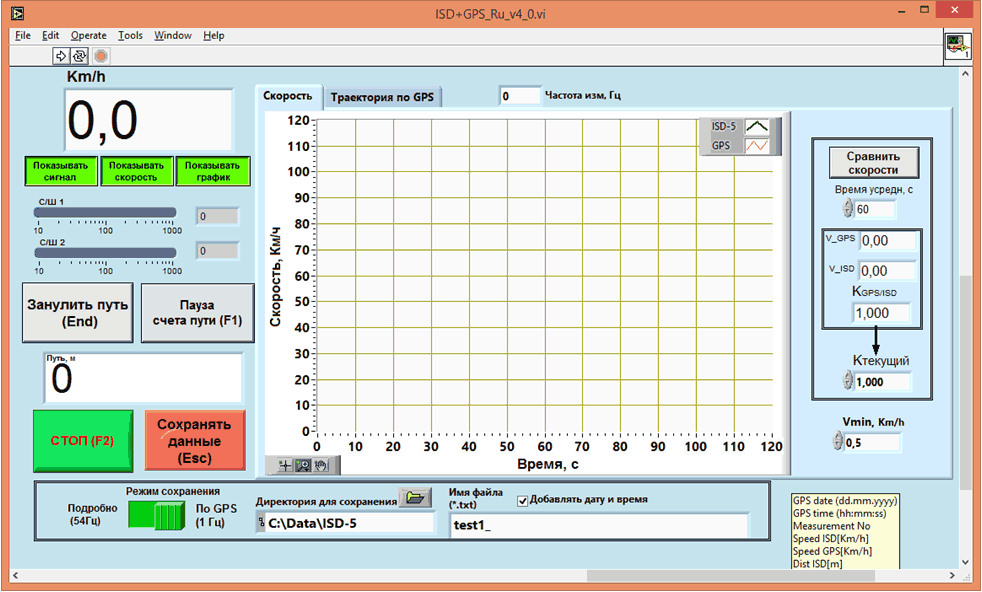
Window view of data gathering, display and storage program:
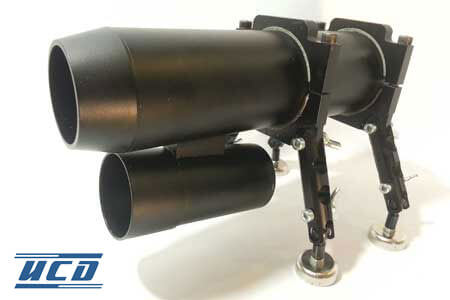
Operation procedure: ISD sensor was installed on a vehicle with magnets to provide maximum vertical and parallel alignment with vehicle axis and GPS module was installed on a roof. Calibration procedure was performed as follows: to avoid ISD sensor geometrical alignment errors vehicle was driven for several kilometers on a straight road with efficient GPS coverage. The program calculates correction factor so that ISD and GPS data are fit with accuracy up to < 0.1%. GPS data was considered as a real value. Then long distance drives (up to several hundred kilometers) were driven. The program can be paused in case of deviations from the route (such as visits to the gas station etc.) and movement can be continued from the point where program was initially paused.
After all saved data were verified by special software:
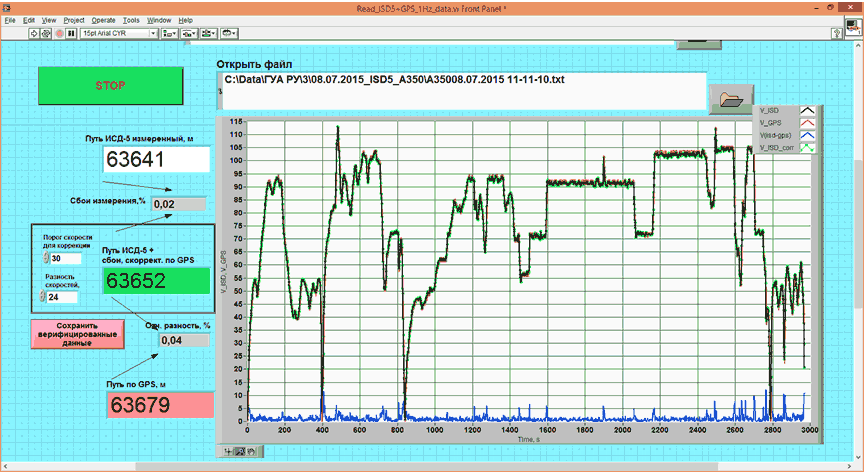
This is where ISD or GPS data interruption can be detected and corrected automatically or route sections can be reviewed in details etc. (blue curve in the bottom specifies the difference between sensors readings). Simultaneous failure of both sensors is highly improbable but if this happens it will be reflected on a graph and may be corrected manually. Usually there is no malfunctioning (as on the picture above) so ISD data can be used for measurement of the distance between bench marks on a map.
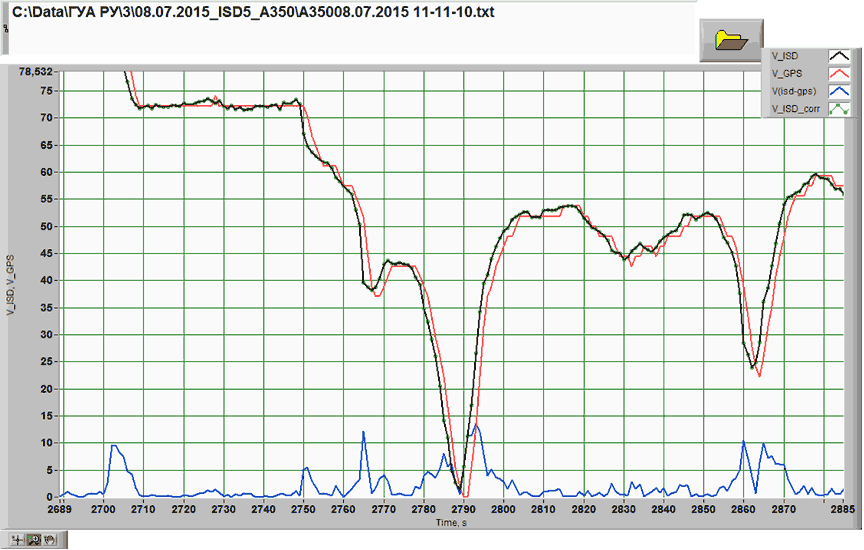
Previous file is more detailed. GPS is delayed exactly for 1 second relatively to ISD (GPS transmits data for the previous second and ISD – for the moment of data saving). This shall be accounted for when route data is compared with coordinates.
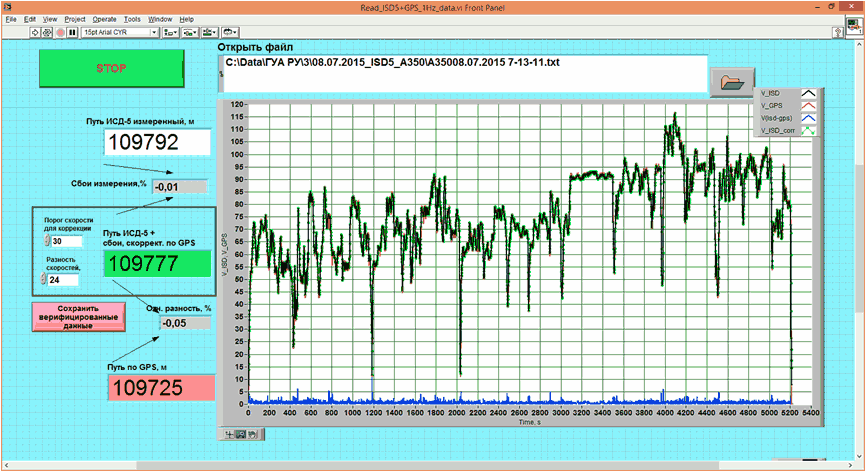
Another example. No fails occurred on a distance longer than 100 km:
Possible occurrences examples are given below:
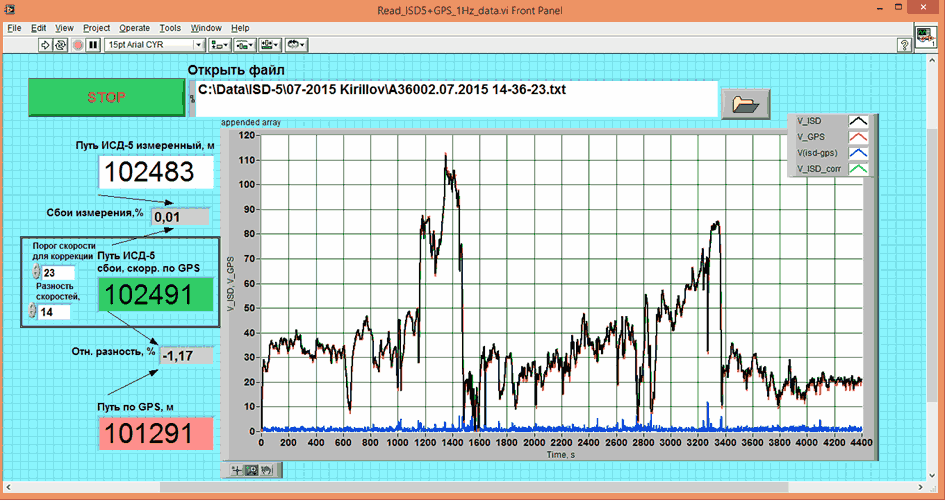
Fig. 2. Low speed and apparently country road with a complex road profile. ISD fails are not detected; GPS data are lower than actual. ISD data shall be considered real value.
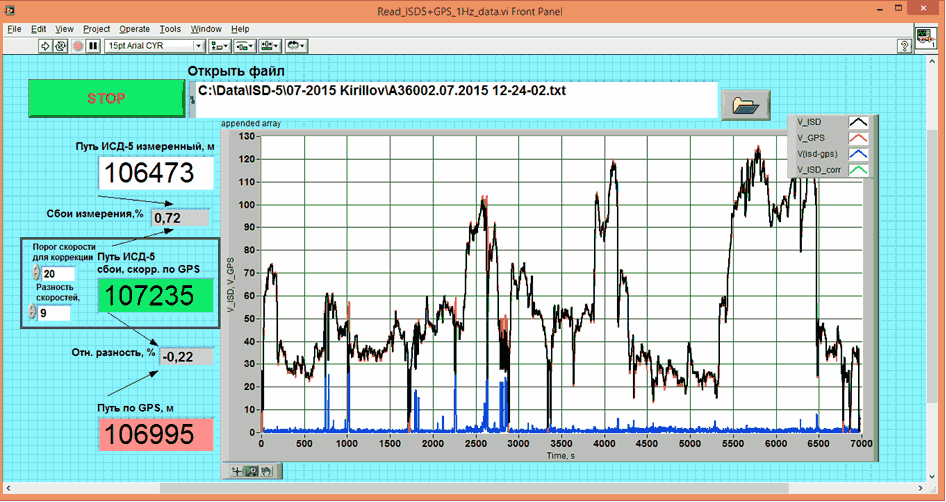
Fig. 4. ISD experienced troubles as we can see. Considerable difference with GPS data are observed (blue curve).
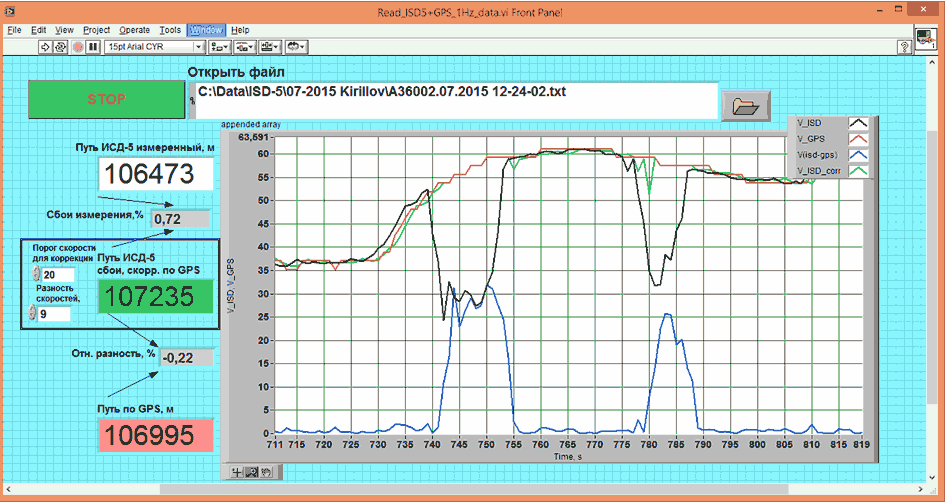
Fig. 5. Part of the graph on Fig. 4. When comparing the curves ISD obviously failed (there are no reasons to doubt GPS data collected at those moments). If required Threshold and Differential values may changed and result in a green graph. Corrected ISD data shall be considered as real value (green indicator).